How much did Blacksmith Docker cache cut our development cycle? Evidence from 1,527 jobs
We do not force the same CI stack into client and internal environments. Many client pipelines begin in GitLab or CodeCommit and follow CodePipeline → CodeBuild → ECR/ECS or CodePipeline → CodeBuild → CodeDeploy/EC2. Keeping source, IAM, network access, and deployment history inside AWS is often the point.
Applications built by 801 PLANET start elsewhere: GitHub → GitHub Actions → Blacksmith → ECR/ECS. GitHub Actions remains the workflow control plane; Blacksmith executes the jobs. AWS access comes from short-lived GitHub OIDC credentials rather than long-lived access keys.1
This is not a recommendation to standardize every environment on Blacksmith. It records what we observed in a real account, how much support the public performance claims have, and where CodeBuild or a self-managed BuildKit service becomes the better choice. The supplied Findy Tools review is members-only beyond its title and public author information, so we did not use it as quantitative evidence.2
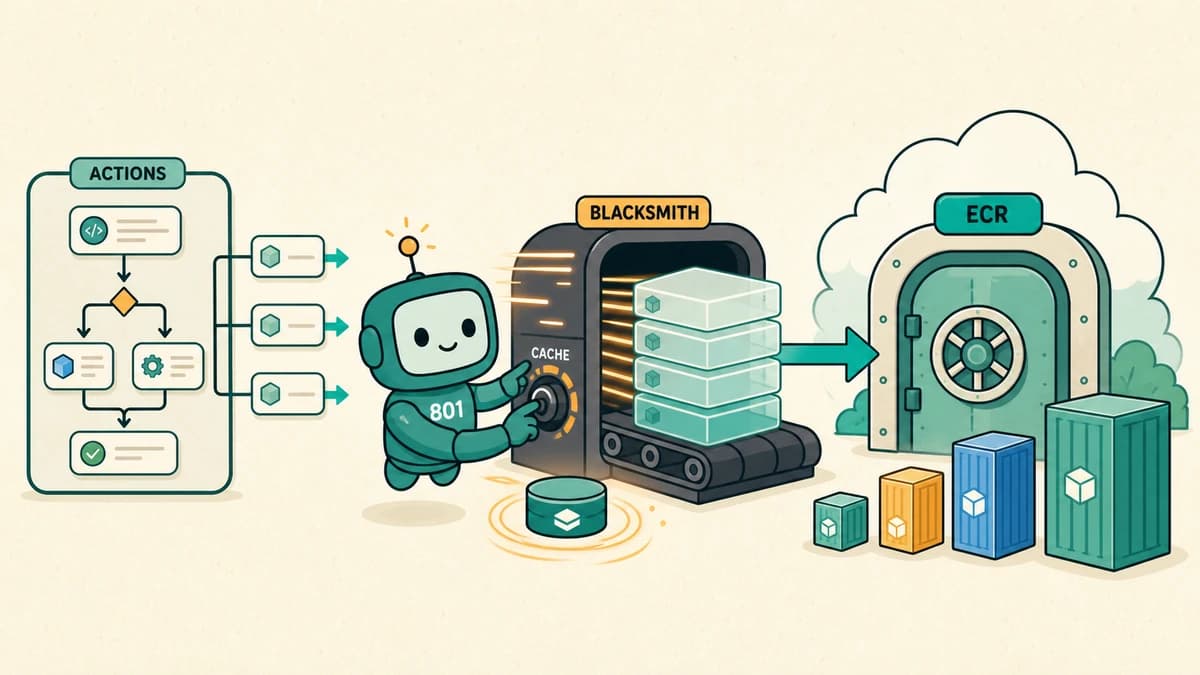
Both paths deploy to AWS, but their control planes differ. In the upper lane, CodePipeline accepts changes from GitLab or CodeCommit and invokes CodeBuild. The container branch pushes an image to ECR for ECS to pull, while the instance branch hands the release to CodeDeploy and EC2.
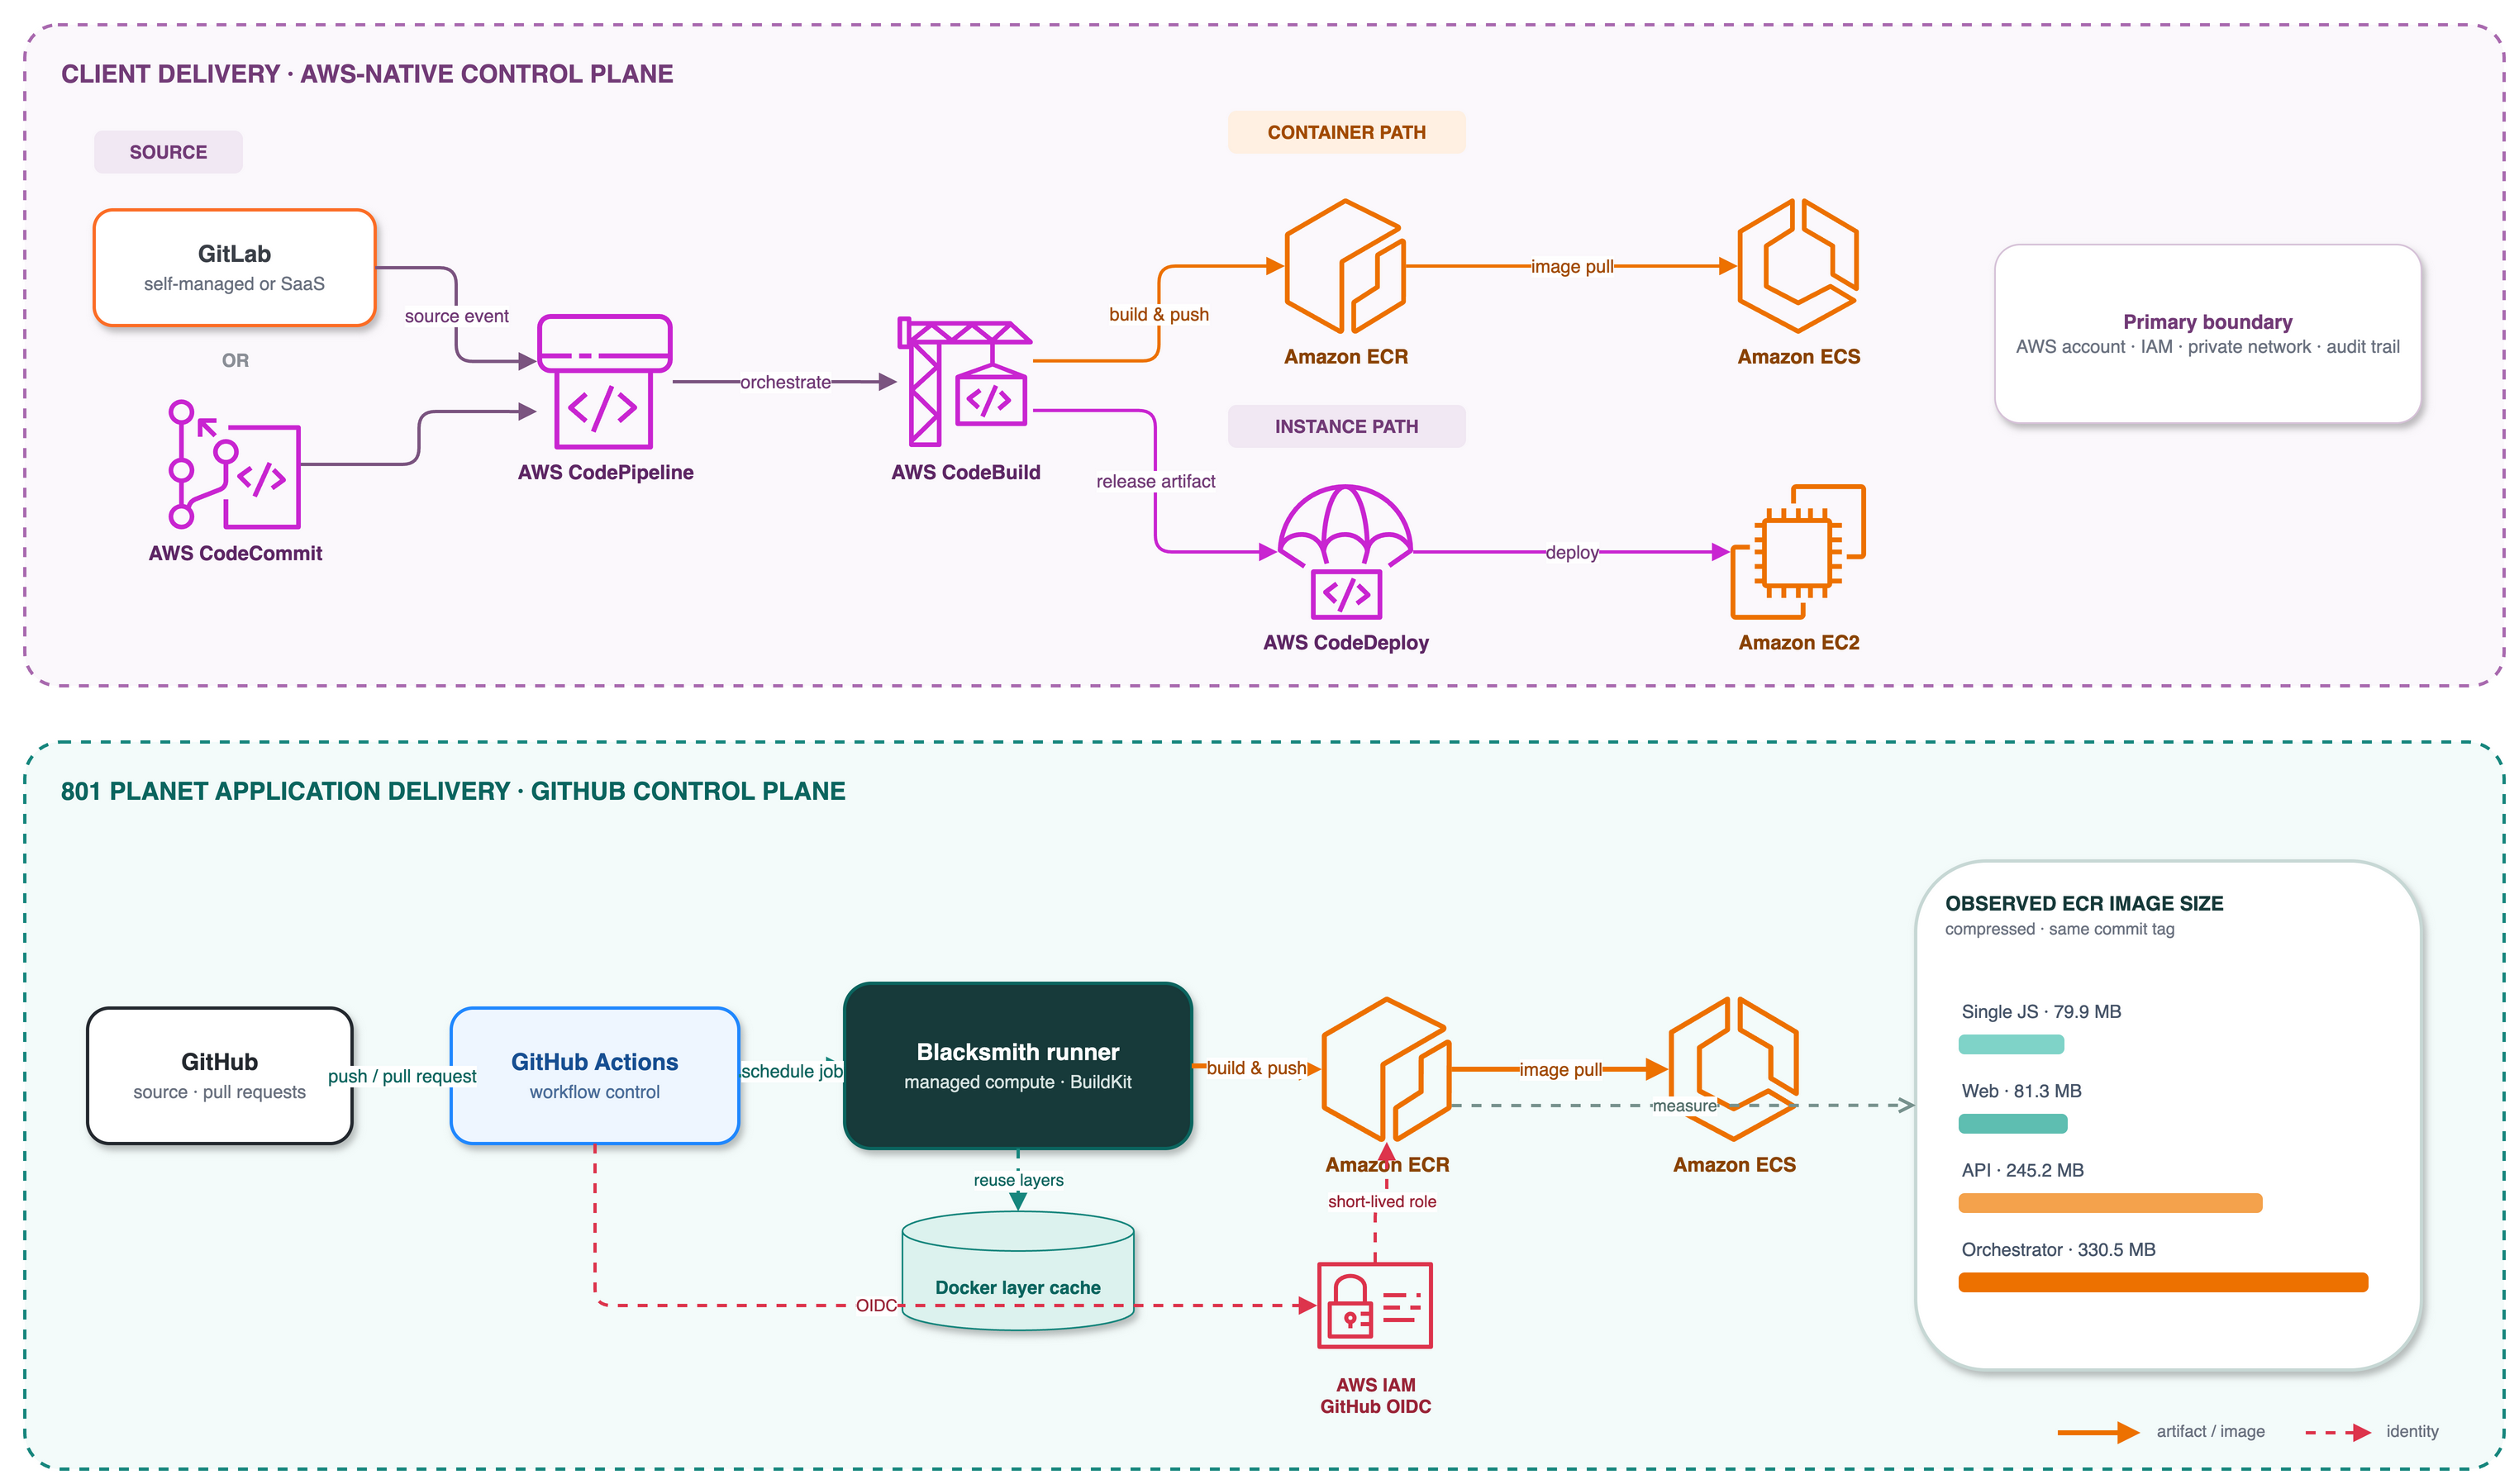
In the lower lane, GitHub Actions controls the workflow and Blacksmith executes the BuildKit job. Docker layers are reused from cache close to the runner. GitHub OIDC assumes a short-lived IAM role, the image is pushed to ECR, and ECS pulls that image. The bars on the right show the compressed ECR sizes of four images checked under the same commit tag.
The two pipelines start from different constraints
| Area | Common client configuration | 801 PLANET applications |
|---|---|---|
| Source and control plane | GitLab or CodeCommit + CodePipeline | GitHub + GitHub Actions |
| Build execution | AWS CodeBuild | Blacksmith managed runners |
| Image and deployment | ECR → ECS or CodeDeploy → EC2 | ECR → ECS |
| Identity boundary | CodeBuild service role and AWS IAM | GitHub OIDC assumes an AWS role |
| Primary constraint | Control and audit inside the VPC and AWS account | GitHub developer flow, fast feedback, no runner operations |
Blacksmith does not replace GitHub Actions as a CI product. It keeps GitHub workflows and actions, then changes the runs-on target to a Blacksmith runner. The official quickstart also says that Blacksmith is limited to GitHub organizations and is unavailable for personal repositories.3
runs-on: blacksmith-2vcpu-ubuntu-2404
The small migration surface is valuable. It disappears when GitLab or CodeCommit is the source of truth. In those environments, CodeBuild or an existing GitLab Runner usually leaves a simpler configuration and audit path.
What six months of production data tells us
From January 23 to July 23, 2026, the unfiltered organization view in Blacksmith CI Analytics recorded 1,527 jobs. Median job duration was 255 seconds, or 4m 15s. The p90 was 5m 40s, p95 6m 46s, p99 12m 45s, and maximum 27m 22s.
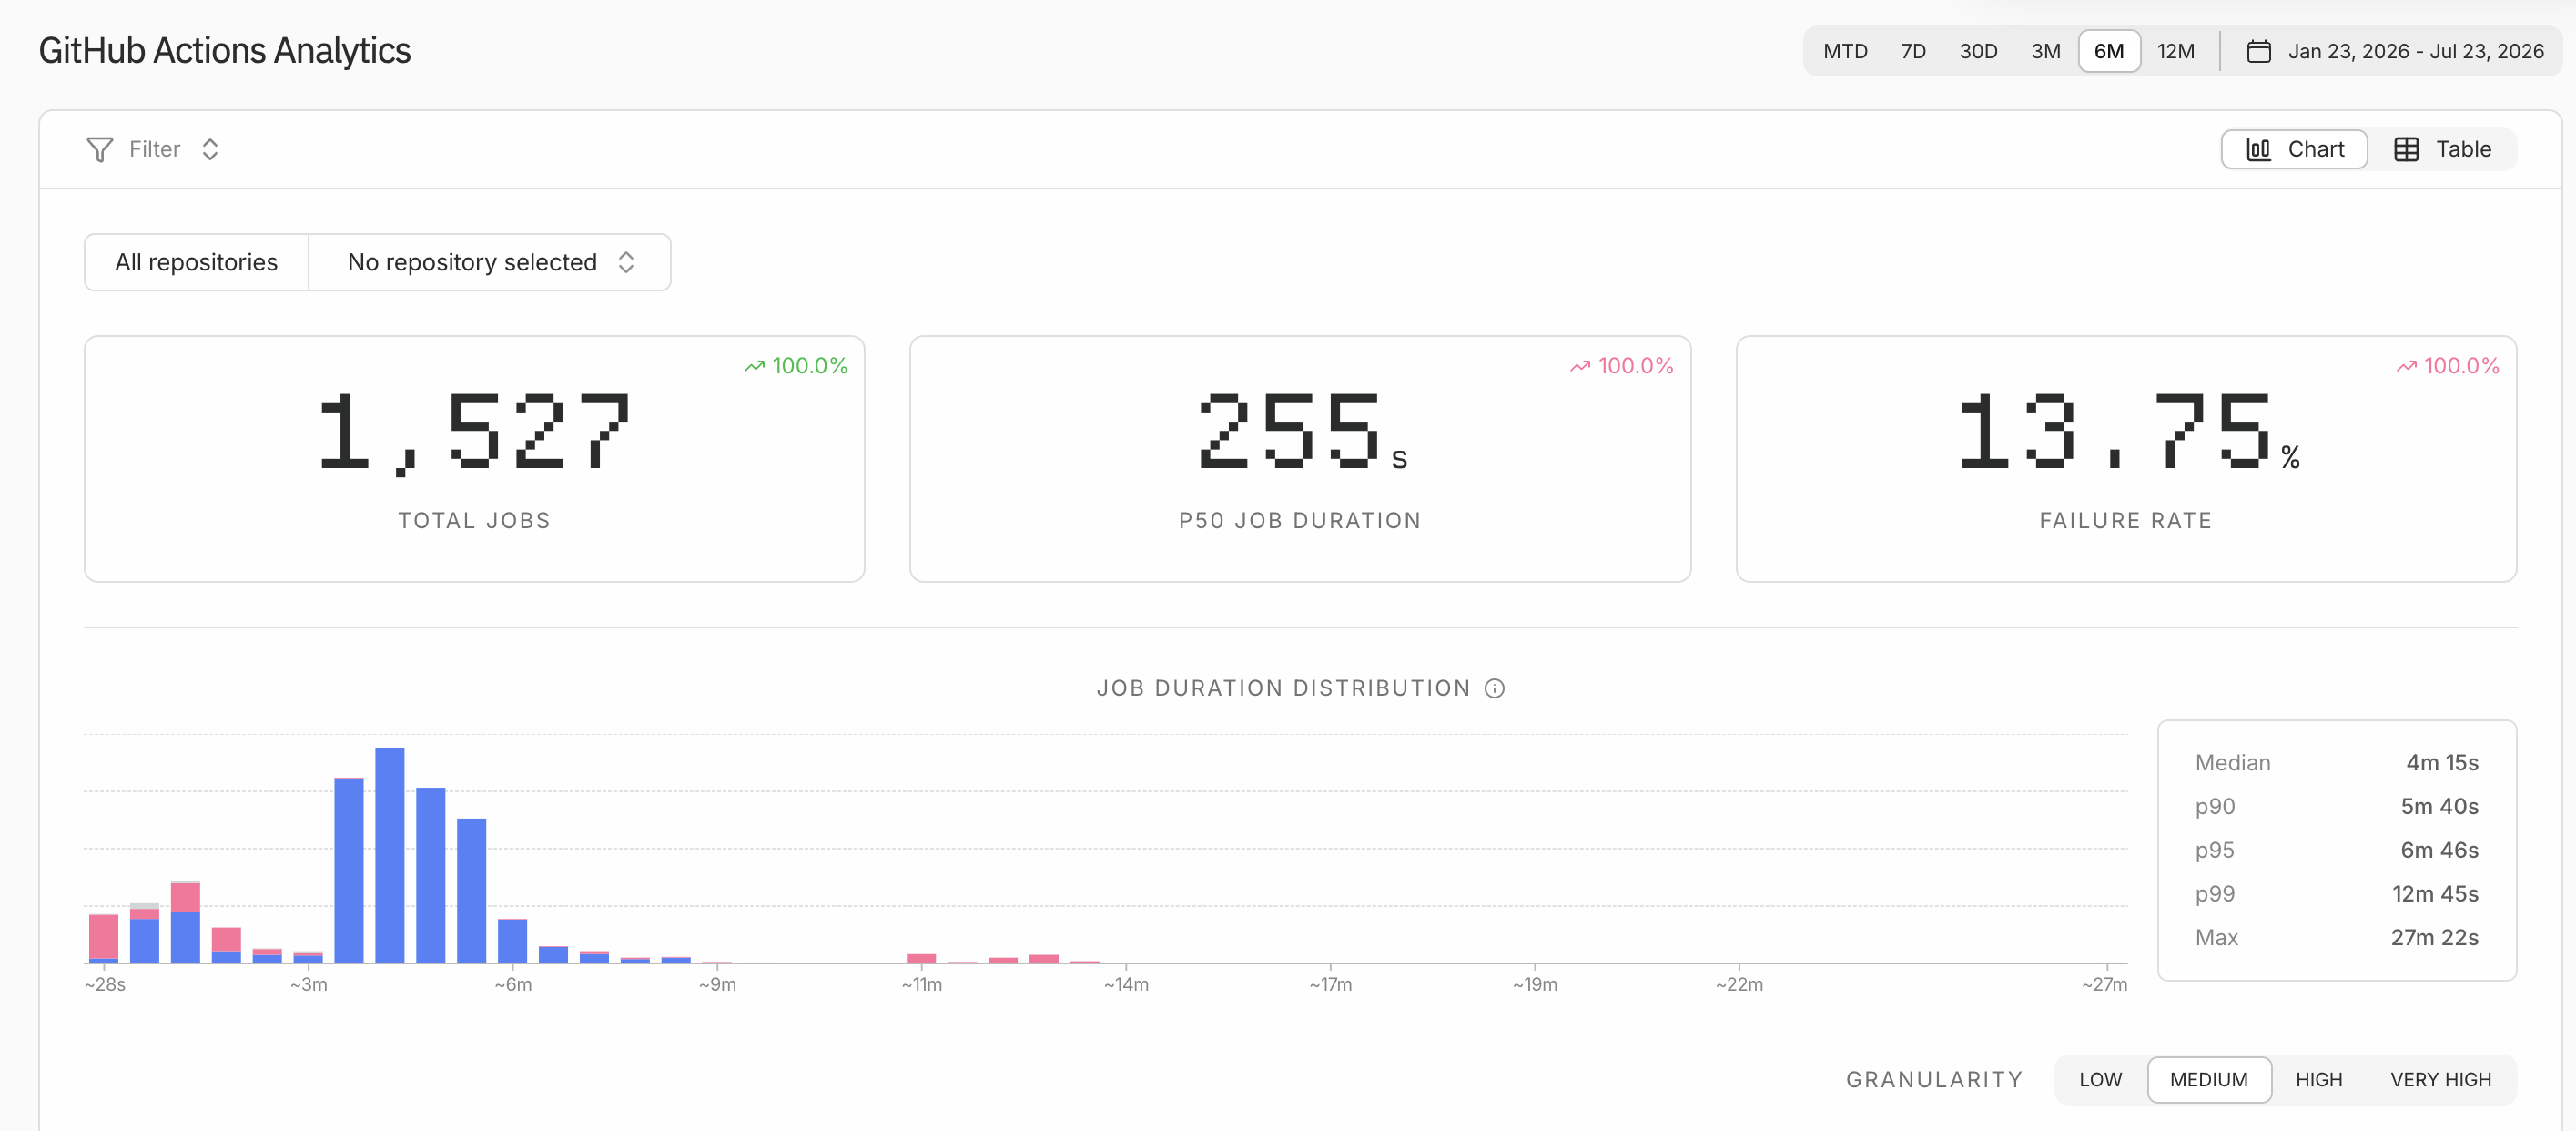
This screen cannot prove that Blacksmith made us a specific multiple faster. We did not preserve an equivalent pre-migration baseline that reran the same commits on GitHub-hosted runners. The 13.75% failure rate is not a Blacksmith incident rate, either. It combines failed tests, application errors, workflow mistakes, and deliberate failures across the organization. It is an operational signal for finding the repositories and jobs to fix.
Over the same selected period, Docker Analytics recorded 1,487 builds, a 9.28% failure rate, and 14.8 GB of average cache use. Most builds clustered under one minute, with a long tail extending to roughly seven minutes.
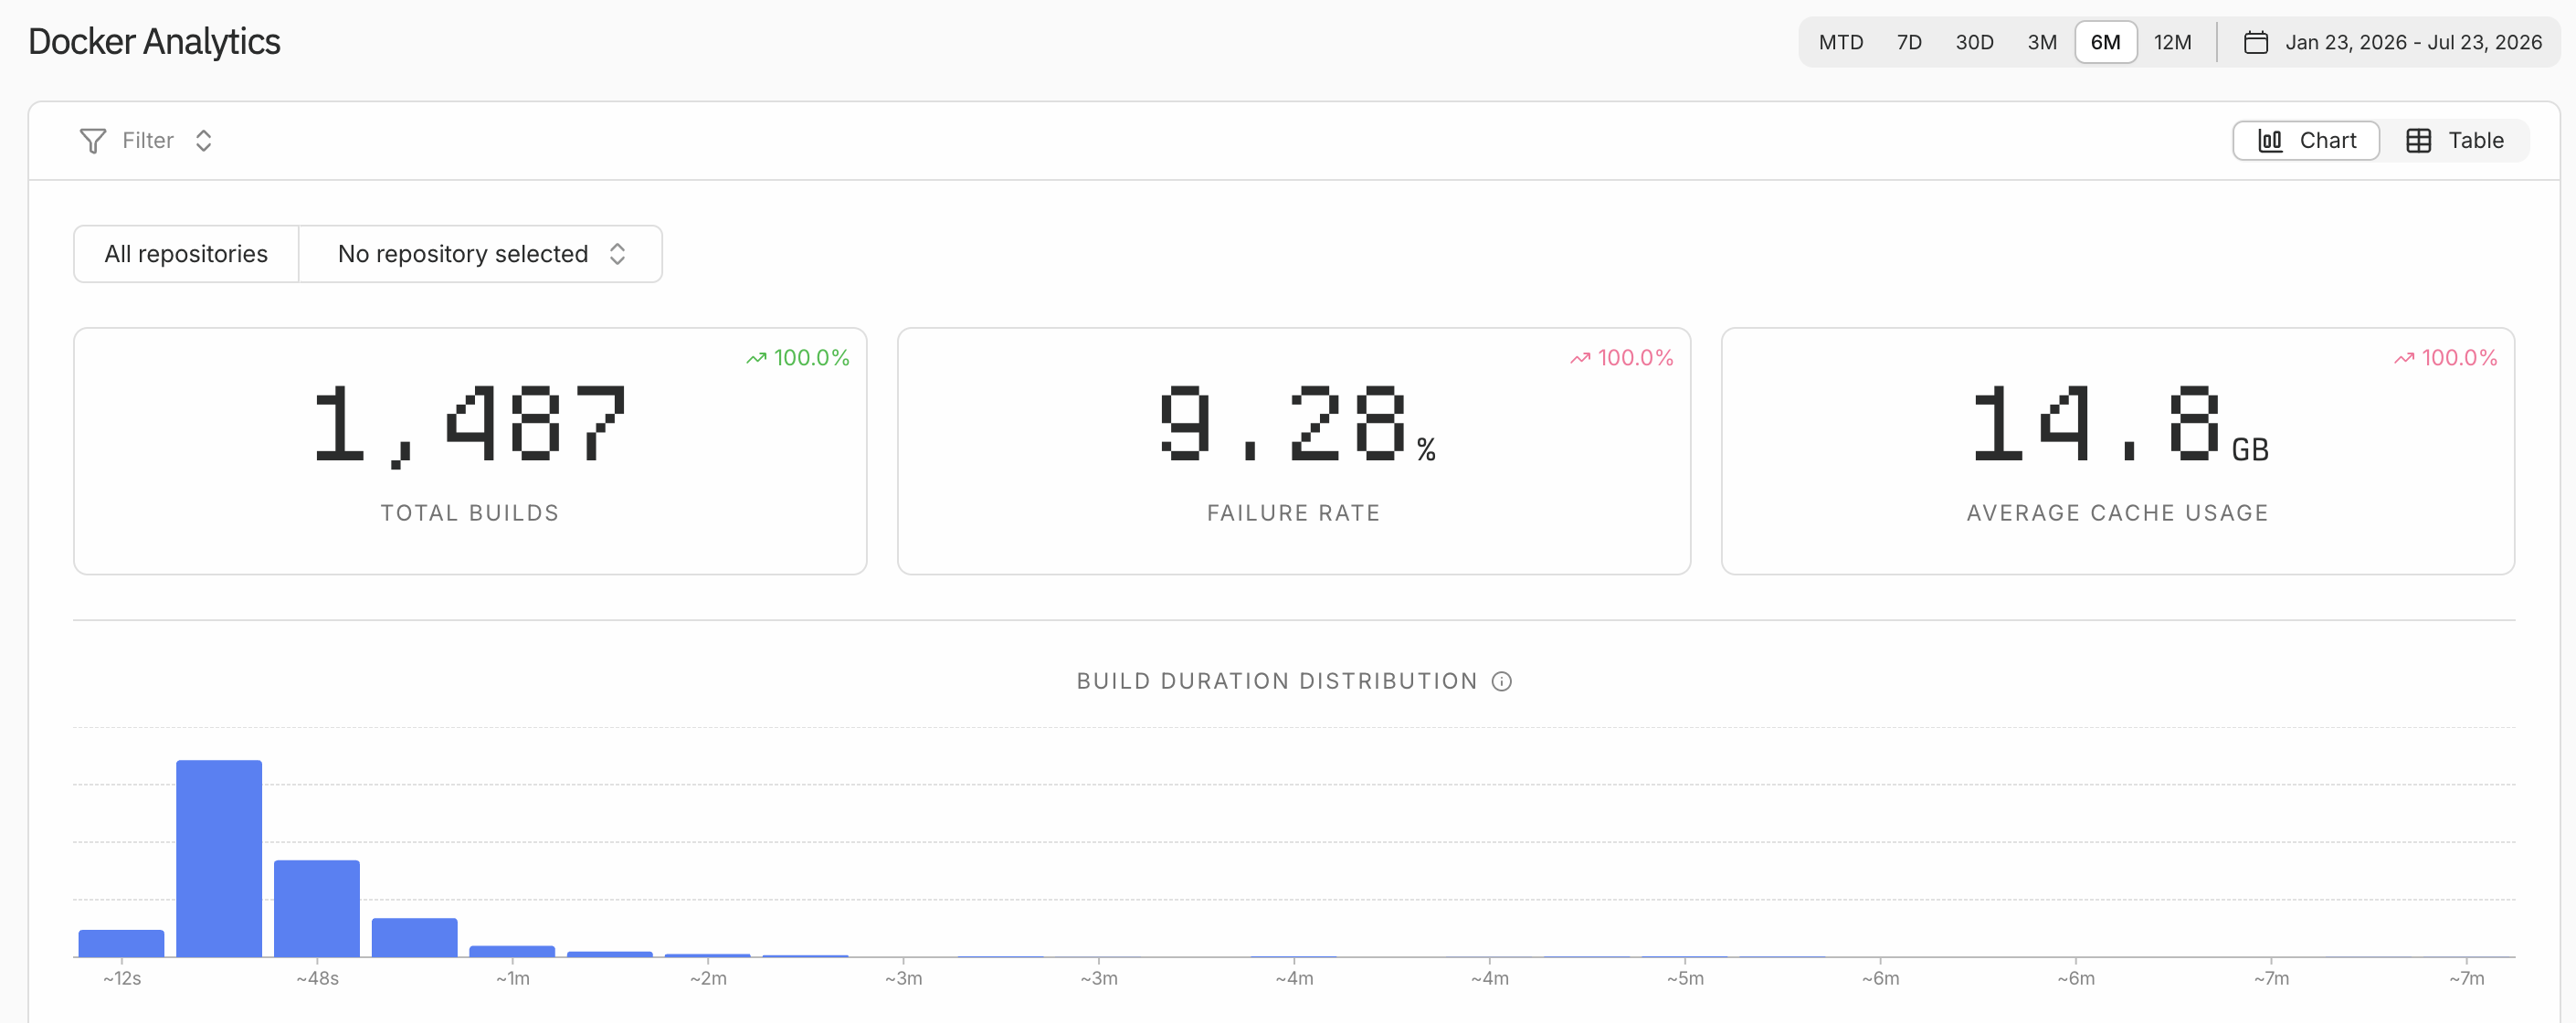
Blacksmith's dashboard breaks down job duration, failure rate, caches, and repository cost in one place.4 It makes long p95 and p99 jobs and repositories with expanding caches easier to find than workflow logs alone. For us, observability was part of the managed-runner decision rather than a cosmetic add-on.
The same cache produced two different result sets
On August 10, 2026, we added a persistent Blacksmith builder and an image-specific cache_key to the production image workflow. We removed external cache-from and cache-to exports and sent the result straight to ECR with push: true. Because Blacksmith persists the whole builder disk, both Docker layers and the pnpm store created through RUN --mount=type=cache can survive into the next run.5
The first before-and-after comparison was not a simple win.
| API Docker build sample | Before | After | Interpretation |
|---|---|---|---|
| Overall median | 77s, n=9 | 98.5s, n=6 | 28% slower with cold and invalidated runs included |
| Warm sample | 77s | 52s, n=3 | 32.5% faster |
| Cold or invalidated sample | 77s | 164s, n=3 | 113% slower |
The first successful Web run after the change was a single 161-second cold build, so we did not treat it as a comparison. The API only improved when its cache lineage continued. A lockfile or Docker input change rebuilt the dependency layer, and the first run on an empty cache took longer than the previous median.
The harder issue was cache snapshot lineage. Several runs reported a successful sticky-disk commit but later restored the same older parent snapshot. One run repeated dependency installation without a lockfile change and spent 77.4 seconds installing the builder. The install layer returned to CACHED only after the next run restored a new snapshot. Blacksmith documents a Last Write Wins policy for concurrent committers using one key, but the builds we inspected did not overlap. We did not claim a confirmed root cause for the stale snapshot.5
We turned cache_key into an execution boundary
The first workflow grouped concurrency by image name and source SHA. Different source commits could therefore write to the same sticky disk at the same time. We changed the boundary to the cache key itself:
concurrency:
  group: build-seal-${{ inputs.cache_key }}
  cancel-in-progress: false
GitHub Actions runs only one job at a time within a concurrency group.6 API, Web, and Automation Orchestrator builds still run in parallel because they use different cache keys. Writers for the same sticky disk wait until the preceding job finishes its post step. The build, signature, and ECR digest contracts stayed unchanged. This was defensive hardening against writer contention, not proof that contention caused the stale snapshots we observed.
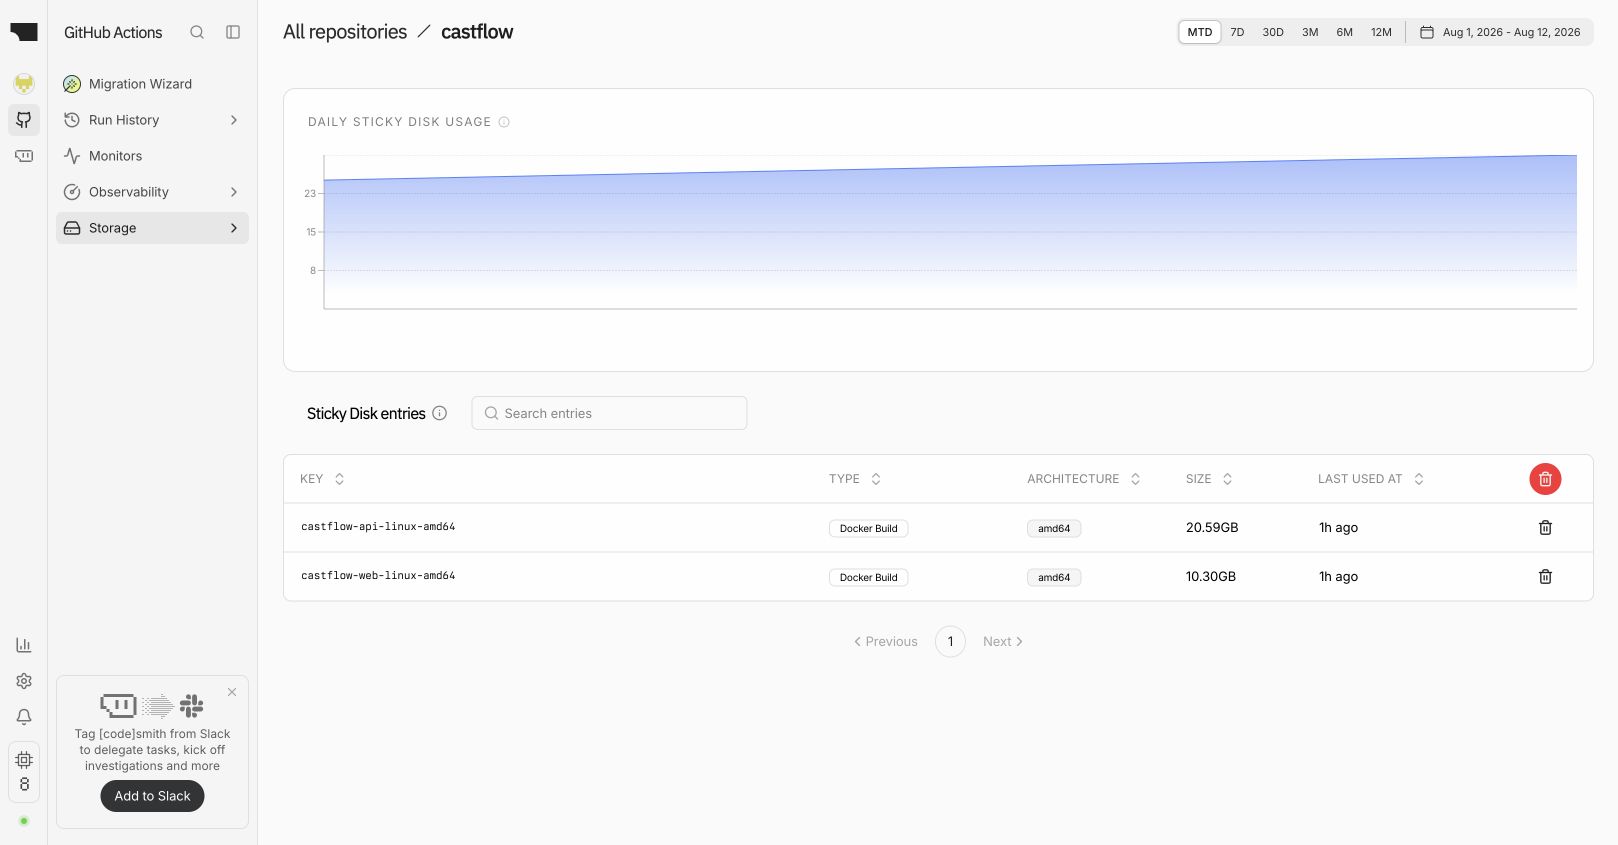
The screen exposes both the reason persistent cache is fast and the state cost behind it. The two caches occupied 30.89 GB at that moment. Applying the published $0.50 per GB-month rate as a simple steady-state estimate yields about $15.45 per month. The invoice will differ because usage changes over time and includes other repositories. Cache size is not hit rate either. Per-image keys reduce eviction by unrelated layers, but an overly fragmented key strategy can add storage without adding reuse.
Five settings changed the development cycle together
After writer serialization reached main, we compared a run that invalidated Docker inputs with a warm run whose inputs stayed unchanged. Docker-step time and full image-job time remain separate because they measure different boundaries.
| Measurement | Cold or invalidated run | Following warm run | Change |
|---|---|---|---|
| API Docker step | 4m26s | 4s | 98.5% faster |
| Full API image job | 5m07s | 38s | 87.6% faster |
| Full Web image job | 4m21s | 36s | 86.2% faster |
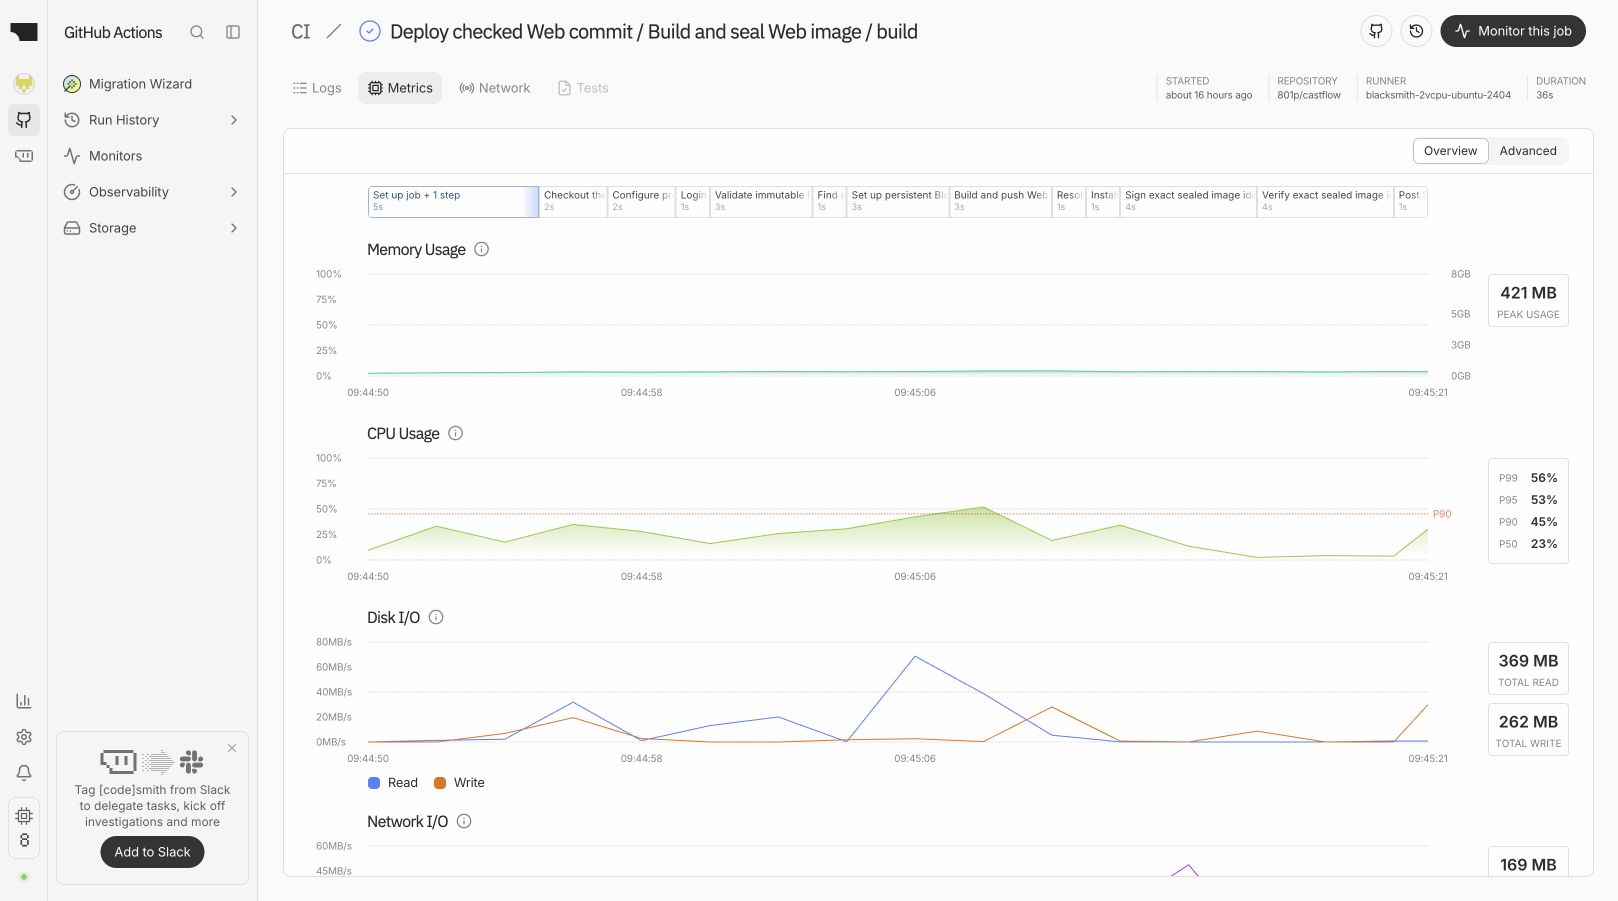
CPU measured 23% at p50 and 56% at p99, while disk I/O totaled 369 MB read and 262 MB written. In this run, reusing prepared cache and image layers mattered more than sustained CPU saturation. Two more controlled warm builds repeated a four-second API Docker step and a three-second Web Docker step. After fixing the log collector, three additional production deployments produced median image jobs of 37 seconds for API and 36 seconds for Web. Thirty-six seconds is not a guarantee for every build, but the evidence no longer rests on one sample.
Setting 1: prepare images in parallel, deploy them in sequence
The original workflow prepared and deployed the API before it even started the Web image. The two image jobs use different cache_key values and do not compete for one sticky disk, so serial preparation added wait without protecting cache state. We changed both image jobs to wait on the same checks and start together while preserving API-before-Web deployment.
build-api-image:
  needs: [checks, instagram-campaign-workflow-acceptance]

build-web-image:
  needs: [checks, instagram-campaign-workflow-acceptance]

deploy-api:
  needs: [build-api-image]

deploy-web:
  needs: [build-web-image, deploy-api]
This dependency graph separates image preparation from release order. API and Web image jobs started one second apart, while Web deployment still waited for API migration and deployment to succeed. Elapsed image-preparation time fell from 3m25s to 2m11s, a 36% reduction. Check completion to full deployment fell from 12m47s to 11m18s, or 11.6%, while effective end-to-end runtime fell from 18m27s to 17m45s, or 3.8%. Overlapping Docker work helped, but ECS wait time still dominated the workflow.
Setting 2: split one CI gate into four jobs and an aggregate gate
A fast Docker build does not shorten development feedback when code review still waits on one serial CI gate. We separated contracts, database upgrade, API tests, and build/lint so they could start together. The protected check name Test, Build, and Lint remained as an aggregate result gate.
| Parallel job | Observed duration |
|---|---|
| CI Contracts and Infrastructure | 1m13s |
| Build and Lint Packages | 1m44s |
| API Tests | 1m50s |
| DB Upgrade | 2m36s |
The pull-request trial cut the critical path from 5m50s to 2m54s, or 50.3%. After the change merged, a main production sample completed checks in 2m18s, removing 3m32s or 60.6% from the original gate. Production image and deployment jobs remained skipped for pull-request events. Repeated dependency and environment setup raised total runner time by about 28% in the first sample. This trades aggregate compute for earlier review feedback.
Setting 3: read the first cache miss from BuildKit records
We moved cache evidence into the workflow. The observer reads BuildKit duration, cached-step ratio, and the first uncached Dockerfile step and writes them to the job summary.7 It classifies a warm candidate only when the previous source and Docker inputs are unchanged and a sealed image exists. A run over 30 seconds or below 60% cached steps emits a non-blocking warning.
The first main run reported 46 seconds and 43% cached steps for API, and 61 seconds and 41% for Web. Manual logs identified COPY packages/database/ and COPY packages/shared-types/ as the first misses. The job summary still printed First uncached step: none. That did not mean the cache was healthy: docker buildx history logs wrote step logs to stderr while the collector saved only stdout.
docker buildx history logs "$build_id" --progress plain > "$log_file" 2>&1
2>&1 merges stderr into the same log file. After this one-line correction, none means there truly was no uncached Dockerfile step. We then deployed three successive changes that did not modify Docker inputs.
| Production run | API image job | Web image job | Dockerfile cache | Regression warning |
|---|---|---|---|---|
| 31559662302 | 45s | 45s | All API and Web steps cached | None |
| 31560652027 | 35s | 35s | All API and Web steps cached | None |
| 31561526674 | 37s | 36s | All API and Web steps cached | None |
Each deployment began after the previous one finished and was classified docker-inputs-unchanged. This supports the conclusion that per-image cache keys and serialized writers are stable under controlled warm conditions. It does not retroactively prove why the earlier stale snapshot was restored.
Setting 4: harden the caller boundary for delayed reusable workflows
In one production run, a delayed Web reusable workflow was blocked before Docker started because the parent workflow status had not propagated consistently after API deployment. This was not a cache failure. We changed the boundary script to refetch status up to four times at two-second intervals. It now accepts only an active official run or completed/success; failure, cancelled, and skipped remain blocked. Immutable mismatches in source SHA, workflow, repository, or actor fail immediately without retry.
After the correction, API and Web boundary checks each completed in one second, while their Docker build-and-push steps took five and four seconds. API deployment finished in 5m10s and Web in 3m28s, including the previously failing transition. Digest verification, signing, and API-before-Web deployment remained intact.
Setting 5: turn Slack notifications into a deployment status board
The Slack message now carries the environment, ECS cluster and service, commit and immutable image digest, task-definition change, migration, total and stabilization times, running and pending task counts, and the precise failure stage or ECS/migration reason. One message is updated from started to image-ready and finally success or failure. Slack failure does not fail a healthy deployment, but the workflow validates the API ok field, message timestamp, and HTTP errors and emits a GitHub warning. The API and Web production runs completed all three update stages. We did not separately open Slack to verify the final visual rendering.
The project-wide effect is not one number. Warm image jobs stabilized in tens of seconds, and split CI removed 3m32s of review wait. Database migration and ECS stabilization then became the dominant release bottlenecks. Build duration, CI critical path, total runner time, and deployment stabilization time are now separate operating metrics, which is the larger improvement.
What earlier adoption might have been worth
This is not booked profit. We do not have a repository-level warm-eligibility rate for all 1,487 Docker builds, and we did not measure how much shorter waits returned as productive engineering time. The useful answer is therefore a counterfactual model that keeps observations and assumptions separate.
Comparing invalidated runs with the latest warm medians cuts 225 seconds from the Web image job and 270 seconds from the API image job. We round their 247.5-second average to 247 seconds as the time saved by one warm-eligible build. We do not assume that all 1,487 builds would have improved by that amount. Instead, the model varies the share of builds whose Docker inputs remain unchanged and can reuse cache at 30%, 50%, and 70%.
Engineers do not convert every minute of CI wait into productive capacity. They may do other work while CI runs, and several builds can belong to one pull request. We therefore vary the share of elapsed savings that returns as focused work at 25%, 40%, and 60%. Fully loaded engineering cost is an assumed ₩70,000, ₩100,000, or ₩150,000 per hour, and the currency conversion uses an assumed ₩1,400 per US dollar. Neither input is company payroll or an observed exchange rate.
| Scenario | Warm-eligible share | Elapsed time removed | Effective engineer time | Capacity value | Added platform cost | Value before implementation labor |
|---|---|---|---|---|---|---|
| Conservative | 30% | 30.6 hours | 7.7 hours | ₩0.54m | ₩0.12m | ₩0.42m |
| Base | 50% | 51.0 hours | 20.4 hours | ₩2.04m | ₩0.11m | ₩1.93m |
| Upside | 70% | 71.4 hours | 42.9 hours | ₩6.43m | ₩0.11m | ₩6.32m |
Added platform cost starts with a deliberately conservative assumption that today's 30.89 GB of sticky disks existed at the same size for all six months. Six months at $15.45 per month costs $92.70. We then subtract shorter runner time at $0.004 per minute. If cache grew gradually during the period, this overstates storage cost. After applying the currency assumption, the net platform increase is about ₩0.11m to ₩0.12m across the scenarios.58
The 1,487 builds cover the whole organization, while 30.89 GB represents two API and Web caches observed in one repository. We do not assume that every repository has the same cache-cost structure. If other repositories require separate sticky disks, total platform cost will exceed the table. If the observed caches grew gradually over the six months, the table overstates their storage cost.
The base case yields about ₩1.93 million before implementation labor. Most of it comes from 20.4 recovered engineer hours, not the runner bill: compute savings are only $12.24. The economic result depends more on focused time lost to feedback than on the per-minute runner rate.
We did not record the engineering time spent changing the configuration, validating it, and operating the new measurements. At the base-case value of ₩100,000 per hour, implementation and six-month maintenance must remain below 19.3 hours for the result to stay positive. The conservative break-even point is about 6.0 hours. In the 25-second lower-bound model, the value before implementation labor is only ₩0.08m and disappears after 0.8 engineering hour. The table subtracts platform cost from capacity value; it is not final project profit.
We also stress-tested the 247-second input. Using only the 25-second reduction directly observed in the initial API warm median leaves 5.2 elapsed hours and 2.1 effective hours at 50% eligibility. Under the same hourly-cost and currency assumptions, value before implementation labor falls to about ₩0.08m. It remains slightly positive but can disappear once measurement error or additional operating cost is included. Three later full-cache samples strengthen the reproducibility of the 247-second input, but we still did not record implementation and validation labor. The ₩1.93m figure is a base estimate for a cache improvement stabilized six months earlier, not realized profit.
Parallel CI is a separate economic channel. The main sample removes 3m32s, or 212 seconds, from the critical path of each affected pull request. Applying the same 40% focus-recovery rate and ₩100,000 hourly value gives the following sensitivity range.
| Affected pull requests | Review wait removed | Effective engineer time | Time value |
|---|---|---|---|
| 50 | 2.9 hours | 1.2 hours | About ₩0.12m |
| 100 | 5.9 hours | 2.4 hours | About ₩0.24m |
| 200 | 11.8 hours | 4.7 hours | About ₩0.47m |
We do not add these values to the ₩1.93m table because we lack a reliable PR-to-Docker-build mapping. Doing so could count the same wait twice and omit the additional runner use introduced by parallel jobs.
Several secondary effects remain unpriced. Earlier failure feedback lets a developer fix a problem while the previous context is still fresh. Exposing the first uncached step reduces log-search time for the platform engineer. Lower experiment cost allows more changes to be tested in the same period. These are potential benefits, not measured profit. A follow-up pilot should collect per-PR wait time, retry count, and time from failure to the next push.
Three levels of evidence behind the speed claims
"Up to 40x faster Docker builds" is not a guarantee for every workload. Blacksmith's documentation describes it as a 2x to 40x improvement reported by customers.5 Separating the test conditions and source incentives produces a more useful picture.
| Source | Published result | How we use it |
|---|---|---|
| Blacksmith cache engineering post | A 114 MB cache download rose from 49.8 MB/s to 327.5 MB/s | About 6.6x in one example. It shows the effect of co-locating runners and cache, but it is vendor data.9 |
| Agentgateway field report | An E2E job fell from 10–11 minutes to 2–3 minutes | About 3–5x. It is an independent report, with disclosure that Blacksmith sponsors the open-source project.10 |
| Self-managed remote BuildKit | Six Go services fell from about 2 minutes to 10–17 seconds | Persistent caching can be reproduced. A large Node image in the same test became about three minutes slower because of --load transfer.11 |
| 801 PLANET account | 4m 15s median and 1,487 Docker builds | This is organization-wide operating data. The repository-level warm/cold comparison above adds detail, but we still lack a same-commit A/B against GitHub-hosted runners. |
The shared mechanism is straightforward. When an ephemeral runner disappears, BuildKit's workspace and the dependency caches created by RUN --mount=type=cache disappear with it. Blacksmith persists repository-scoped Docker layers and makes them available to later runners. A self-managed version requires a remote buildkitd, persistent storage, garbage collection, concurrency control, isolation, and recovery.
The gain can be large when cache reuse and single-core CPU performance dominate. It may be small or negative when a workflow spends its time loading a large image back into the runner with --load, transferring to a remote registry, or waiting on integration tests. Compare p50, p95, cache hit rate, and cost per successful job on the same commits, not the largest marketing multiple.
Final image size belongs in the runner comparison
The four final images in ECR ranged from 79.9 to 330.5 MB compressed. The files and production dependencies retained in each runner stage explain most of that spread.
On July 23, 2026, we queried four internal ECR repositories in the Seoul region with read-only access. We inspected DescribeImages.imageSizeInBytes and the OCI manifest layer list for the same commit tag in every repository. Account IDs and repository names remain private. These are compressed registry sizes, not the uncompressed number shown by local docker images or the disk footprint of a running container.12
| Final image role | Main content retained in the runner stage | Compressed ECR size | Layers | Largest compressed layer |
|---|---|---|---|---|
| Web | Next.js standalone, public, and static output | 81.3 MB | 10 | 41.4 MB |
| API | Production dependencies, NestJS dist, and Prisma | 245.2 MB | 17 | 114.6 MB |
| Single-JS runtime | Node.js runtime and dist/main.js | 79.9 MB | 7 | 49.9 MB |
| Automation orchestrator | Production dependencies plus Temporal and database workspace output | 330.5 MB | 20 | 192.3 MB |
All four Dockerfiles use multi-stage builds. They copy the lockfile and workspace package.json files before source code, then run pnpm install. That ordering lets an application-only change reuse the dependency layer. The root .dockerignore also removes node_modules, existing dist and .next output, infrastructure code, documentation, and .github from the build context. Docker recommends the same pattern: put expensive, stable steps early and keep the context small.13
The final runner stage determines the result. The web image copies Next.js standalone and static output and weighs 81.3 MB. The API keeps production dependencies, compiled output, and Prisma files and reaches 245.2 MB. The single-JS image adds only dist/main.js to the Node.js runtime and weighs 79.9 MB. The orchestrator retains production dependencies and outputs from its Temporal and database workspaces and reaches 330.5 MB. Multi-stage builds exclude builder tooling in every case, yet the runtime boundary still creates a spread of more than 4x.14
Our workflows use docker/build-push-action with push: true, sending the result directly to ECR instead of loading a large image back into the runner with --load. A dependency change can still invalidate and transfer a layer larger than 100 MB. A nearby Blacksmith cache cannot repair poor application-layer boundaries or shrink a heavy runtime image.
Runner time alone is not enough for the pilot. Alongside cold- and warm-cache duration for the same commits, record compressed ECR size, the largest changed layer, push time, and time until the new ECS task becomes ready. A fast cache and a small deployable image answer different questions.
Separate unit-rate math from the invoice
As of July 23, 2026, a standard GitHub-hosted Linux 2-core runner is $0.006 per minute, while a Blacksmith Ubuntu x64 2 vCPU runner is $0.004 per minute.158 The AWS CodeBuild pricing example uses $0.005 per minute for general1.small.16
If the same 10,000 billed minutes were charged before plan allowances, cache, and logging, the compute-only comparison would look like this:
| Execution layer | Published rate | Compute for 10,000 minutes | Additional considerations |
|---|---|---|---|
| GitHub-hosted Linux 2-core | $0.006/min | $60 | Plan-included minutes, Actions cache and artifact storage |
| Blacksmith Ubuntu x64 2 vCPU | $0.004/min | $40 | Docker layer cache at $0.50/GB-month; static IP at $100/IP-month |
CodeBuild general1.small example | $0.005/min | $50 | 100 free minutes; CloudWatch Logs, S3, KMS, and CodePipeline |
This isolates rate cards; it is not a TCO ranking. CPU generation, memory, minute rounding, actual runtime, network, and cache behavior differ. CodeBuild also offers a Docker image server with a shared layer cache, billed while the server runs and at a lower cache-at-rest rate during cooldown.16 At Blacksmith's current cache price, the observed 14.8 GB average is a simple $7.40 per month equivalent.
Our invoices were smaller. From March through July 2026, the five charges were $4.31, $6.26, $22.13, $4.65, and $9.97. They total $47.32, or $9.46 per month on average.
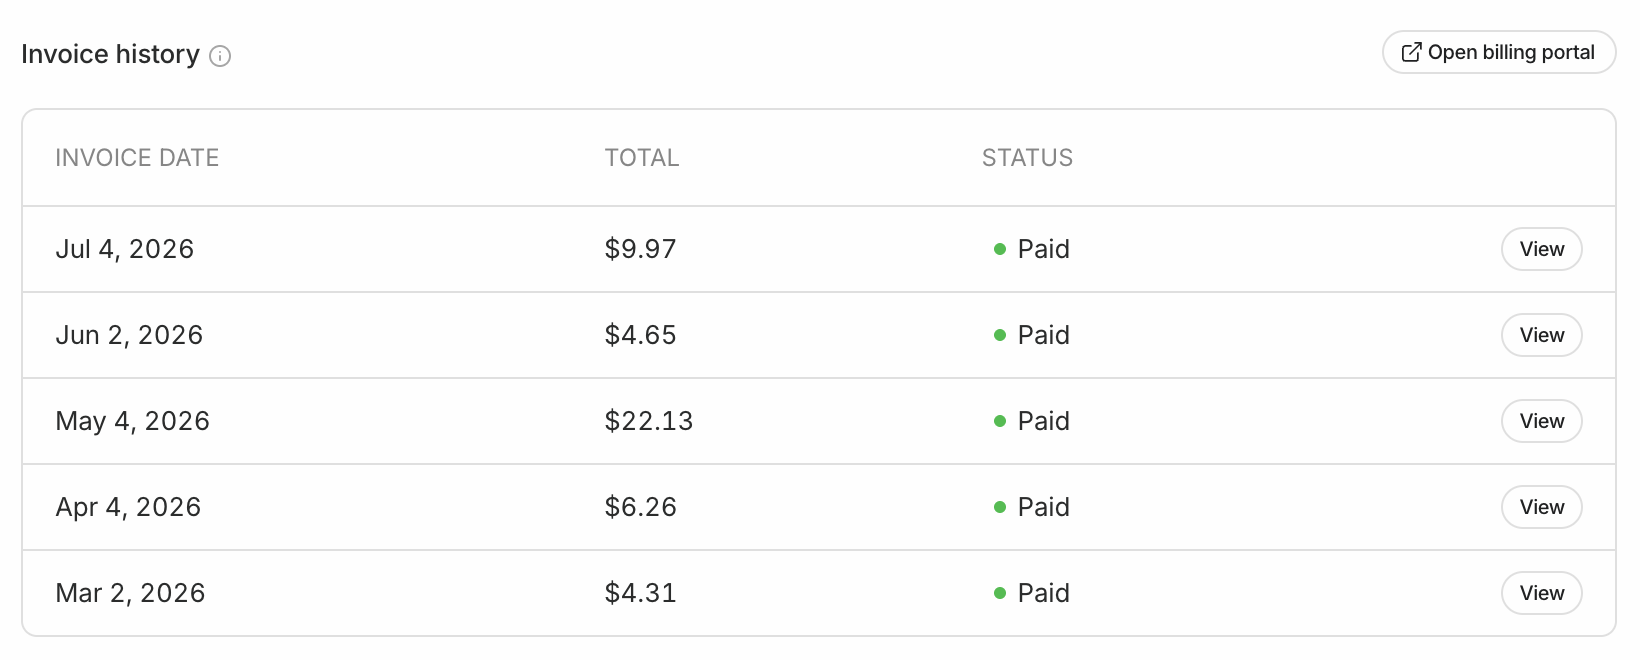
The invoice window covers March through July, while Analytics covers January through July. The periods do not match. Median duration is not mean duration, so we also did not estimate total usage as 1,527 × 255 seconds. The defensible conclusion is limited: this was our actual spend at the current scale.
Where CodeBuild and Blacksmith diverge
| Decision factor | CodeBuild is the natural fit when | Blacksmith is the natural fit when |
|---|---|---|
| Source and workflow | GitLab, CodeCommit, and CodePipeline define the flow | A GitHub organization and GitHub Actions define the flow |
| AWS identity | A CodeBuild service role keeps control in the account | GitHub OIDC sub conditions scope access by repository and branch |
| Private networking | Builds need VPC access to RDS, internal ECS, or private repositories | External runners can deploy through OIDC and public AWS APIs |
| Docker cache | The team operates AWS cache or a Docker image server | The team wants repository-scoped persistent cache with managed runners |
| Operations | buildspec, IAM, CloudWatch, and CodePipeline form one operating model | Runner provisioning, disk, GC, and CI analytics belong with a provider |
| Governance | An AWS-only supplier boundary matters | A separate GitHub App and execution vendor can pass review |
CodeBuild projects can attach a VPC ID, subnets, and security groups to reach private RDS, ElastiCache, internal ECS, and private artifact repositories.17 Blacksmith offers a dedicated static egress IP, but the current public rate is $100 per IP each month.18 When private network access is mandatory, network design and security review should precede runner-minute math.
Blacksmith's security page states SOC 2 Type 2 and GDPR compliance, ISO 27001 data centers, and a fresh Firecracker microVM per job. Its GitHub App requests permissions needed to edit workflows and mint JIT runner tokens.19 Those claims are inputs to a vendor review, not a replacement for one.
Why Blacksmith fit our own stack
Our code review and source flow already live in GitHub, and we frequently build Docker images for ECR and ECS. For a small team, buying a managed execution layer was more sensible than operating Actions Runner Controller or an EC2 runner pool, including scaling, patching, disks, and BuildKit garbage collection. GitHub OIDC opens AWS access briefly, with role sub conditions tied to the repository and branch.
That choice does not put Blacksmith into every client pipeline. We keep CodePipeline and CodeBuild where GitLab, CodeCommit, private VPC access, and AWS service roles define the environment. The opposite design — bringing source and build fully inside a private platform — appears in our NKS modernization pipeline with GitLab and Jenkins.
Blacksmith fit our stack for three reasons: it retained the GitHub Actions files, removed Docker cache operations, and put jobs, caches, failures, and cost in one dashboard. Six months of data shows that this configuration runs in production. It does not prove a universal speed multiplier.
Run a two-week pilot before adopting it
- Select two Docker-heavy workflows and record baseline p50, p95, queue time, success rate, and monthly cost.
- Rerun the same commits on GitHub-hosted and Blacksmith runners, separating cold-cache and warm-cache results.
- Set a Docker cache ceiling with
max-cache-size-mb, then monitor cache hit rate and monthly GB together. Record the first uncached step, compressed ECR size, and the largest changed layer.5 - Measure the Docker step, full image job, CI critical path, and total runner time separately. Parallel work can reduce waiting while increasing compute.
- Review the AWS OIDC
audandsub, GitHub App permissions, pinned third-party actions, and static-IP requirements. - Do not assume a free allowance is a hard stop. Confirm budgets and shutdown behavior. A 2026 public account described receiving a $1,081 invoice after usage continued beyond the free allowance.20
Changing one workflow line is easy. The decision begins afterward. Measure whether reviewers wait less, and whether the cost of getting one successful change through CI without runner operations falls.
Frequently asked questions
What is Blacksmith
Blacksmith is a managed runner service for GitHub Actions. GitHub retains workflow control; Blacksmith supplies isolated execution, co-located dependency caching, persistent Docker layer caching, and CI Analytics. Teams adopt it by changing the runs-on label in workflows inside a GitHub organization.
Can Blacksmith replace AWS CodeBuild
Not universally. Blacksmith fits when GitHub Actions is the control plane and the team wants to remove runner operations. CodeBuild is usually simpler when GitLab or CodeCommit, CodePipeline, private VPC access, and AWS service roles define the system. They are execution layers attached to different control planes.
Can Blacksmith push images to ECR and deploy ECS
Yes. A GitHub Actions workflow assumes a narrowly scoped AWS IAM role through OIDC, then receives permissions to push to ECR and update ECS. Avoid long-lived AWS access keys in GitHub Secrets, and constrain the role's sub condition to approved repositories and branches.
Can a team reproduce Blacksmith's speed itself
The core mechanism is reproducible. A remote BuildKit daemon with persistent storage and nearby cache lets ephemeral runners reuse build state. The team then owns garbage collection, concurrent builds, isolation, patching, recovery, and cost visibility. Blacksmith's value is less the cache idea than operating that execution layer.
If you need to measure a GitHub CI bottleneck or draw the boundary between CodeBuild, managed runners, and self-managed BuildKit, our Cloud & Infrastructure work starts with the current workflow and AWS network. For the AWS-internal traffic path around ECR, continue with AWS's invisible costs.
References
We checked pricing and the original product behavior on July 23, 2026. We rechecked Docker cache keys, Last Write Wins behavior, GitHub Actions concurrency, and build records on August 12. The 801 PLANET figures come from organization-wide dashboards, payment history, repository GitHub Actions runs, and Blacksmith job Metrics. A same-commit A/B against GitHub-hosted runners and long-term data for the parallel CI trial remain outside this article.
Sources & notes20ExpandCollapse
Footnotes
-
GitHub Docs, Configuring OpenID Connect in Amazon Web Services. Assuming AWS roles without long-lived credentials and scoping
audandsub. ↩ -
Findy Tools, Blacksmith で手軽に GitHub Actions を高速化&コスト削減. Only the title and author are public; no gated quantitative claims were used. ↩
-
Blacksmith Docs, Quickstart. GitHub organization integration, runner-label migration, and organization-only limitation. ↩
-
Blacksmith Docs, CI Analytics. Job duration, failure rate, cache, and repository-cost views. ↩
-
Blacksmith Docs, 40x Faster Docker Builds. Repository Docker layer cache,
max-cache-size-mb, last-write-wins concurrency, seven-day inactive eviction, and $0.50/GB-month pricing. ↩ ↩2 ↩3 ↩4 ↩5 -
GitHub Docs, Control the concurrency of workflows and jobs. One running job per concurrency group and the effect of
cancel-in-progress. ↩ -
Docker Docs, GitHub Actions build summary. Dockerfile, build duration, cache utilization, and downloadable build records. ↩
-
Blacksmith, Pricing. Ubuntu x64 2 vCPU rate, included minutes, cache, and static-IP add-ons. ↩ ↩2
-
Aaditya Sondhi, Blacksmith, Reverse engineering GitHub Actions cache to make it fast, July 23, 2025. Co-located MinIO cache and the 114 MB download comparison. ↩
-
John Howard, Fast GitHub Actions with Blacksmith, April 10, 2026. Agentgateway E2E before/after result and sponsorship disclosure. ↩
-
Javier Cabrera Arteaga, Remote buildkit agents to speed up Docker builds by 10 times, November 4, 2025. Persistent BuildKit experiment, Go improvement, and Node
--loadregression. ↩ -
AWS CLI, Amazon ECR
describe-images.imageSizeInBytesreports compressed registry size, which can be smaller than the uncompressed size shown by localdocker images. ↩ -
Docker Docs, Optimize cache usage in builds. Order expensive and stable steps first, copy package manifests before source, and keep the build context small. ↩
-
Docker Docs, Multi-stage builds. Copy only required artifacts from a builder stage into the final stage, leaving build tools and intermediate files behind. ↩
-
GitHub Docs, Actions runner pricing. Linux 2-core x64 per-minute rate. ↩
-
AWS, AWS CodeBuild pricing. On-demand minute billing, the
general1.smallexample, 100 free minutes, additional charges, and Docker image server. ↩ ↩2 -
AWS Docs, Use AWS CodeBuild with Amazon VPC. VPC, subnet, and security-group attachment for private resources. ↩
-
Blacksmith Docs, Static IP and Pricing. Organization-specific WireGuard tunnel and static-IP rate. ↩
-
Blacksmith, Secure GitHub Actions, updated August 8, 2025. GitHub App permissions, JIT token, Firecracker isolation, and compliance statements. ↩
-
Allen Pike, Forestwalk, Surprise! Pay $1000, June 8, 2026. A public account of continued usage and billing beyond the free allowance. ↩